import matplotlib.pyplot as plt
import seaborn as sns
from sklearn import metrics
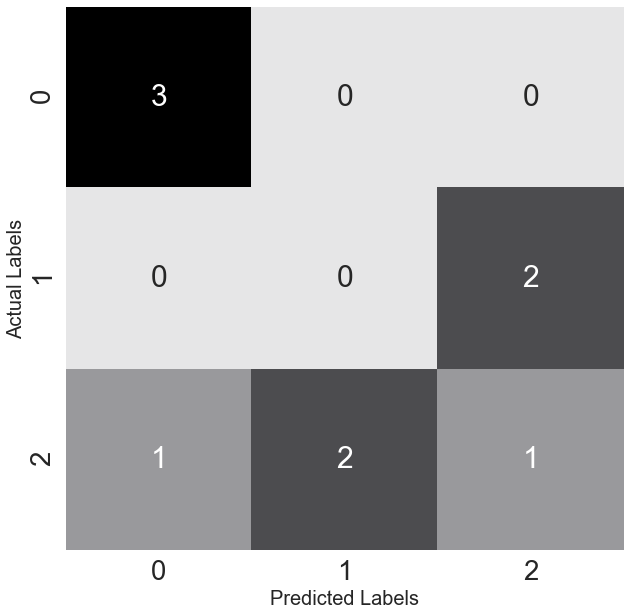
y_true = [0, 1, 2, 0, 1, 2, 0, 2, 2]
y_pred = [0, 2, 1, 0, 2, 1, 0, 0, 2]
cm = metrics.confusion_matrix(y_true, y_pred)
plt.figure(figsize=(10, 10))
cmap = sns.cubehelix_palette(50, hue=0.05, rot=0, light=0.9, dark=0,
as_cmap=True)
sns.set(font_scale=2.5)
sns.heatmap(cm, annot=True, cmap=cmap, cbar=False)
plt.ylabel(‘Actual Labels‘, fontsize=20)
plt.xlabel(‘Predicted Labels‘, fontsize=20)
原文:https://www.cnblogs.com/songyuejie/p/14784736.html