分析 Linux 网络协议栈性能有多种方式和工具。本文主要通过 Perf 生成 On-CPU 火焰图的方式,分析 Linux 内核网络协议栈在特定场景下的性能瓶颈,从而知晓当前协议栈的网络状况。
|
1
2
3
|
On-CPU: where threads are spending time running on-CPU.
Off-CPU: where time is spent waiting while blocked on I/O, locks, timers, paging/swapping, etc.
|
在工程实践中,如果是 CPU 消耗型使用 On-CPU 火焰图,如果是 IO 消耗型则使用 Off-CPU 火焰图。如果无法确定, 可以通过压测工具来确认: 通过压测工具看能否让 CPU 使用率趋于饱和,从而判断是否为 CPU 消耗型。
Perf 火焰图整个图形看起来就像一团跳动的火焰,这也正是其名字的由来。燃烧在火苗尖部的就是 CPU 正在执行的操作,不过需要说明的是颜色是随机的,本身并没有特殊的含义,纵向表示调用栈的深度,横向表示消耗的时间。因为调用栈在横向会按照字母排序,并且同样的调用栈会做合并,所以一个格子的宽度越大越说明其可能是瓶颈。综上所述,主要就是看那些比较宽大的火苗,特别留意那些类似平顶山的火苗。
火焰图是基于 stack 信息生成图片, 用来展示 CPU 调用栈。
火焰图就是看顶层的哪个函数占据的宽度最大。只要有“平顶”(plateaus),就表示该函数可能存在性能问题。

|
1
2
|
While this can be very effective for studying on-CPU issues, including hot code-paths and adaptive mutex spins, it doesn‘t gather data when the application has blocked and is waiting off-CPU.
|
server
yum install iperf
yum install perf
git clone https://github.com/brendangregg/FlameGraph.git
运行 iperf server
[root@bogon ~]# iperf -s -u -D
Running Iperf Server as a daemon
[root@bogon ~]#
查看 CPU 以及 softirqd 进程号
[root@bogon ~]# lscpu
Architecture:          aarch64
Byte Order:            Little Endian
CPU(s):                64
On-line CPU(s) list:   0-63
Thread(s) per core:    1
Core(s) per socket:    4
Socket(s):             16
NUMA node(s):          4
Model:                 2
BogoMIPS:              100.00
NUMA node0 CPU(s):     0-15
NUMA node1 CPU(s):     16-31
NUMA node2 CPU(s):     32-47
NUMA node3 CPU(s):     48-63
Flags:                 fp asimd evtstrm aes pmull sha1 sha2 crc32 cpuid
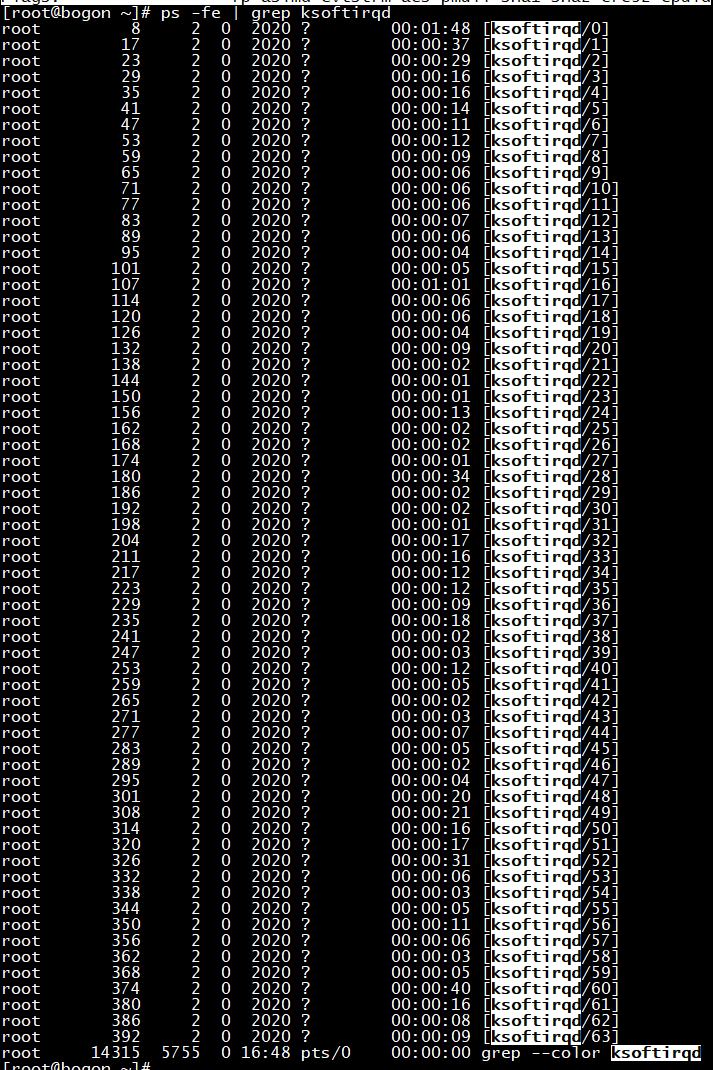
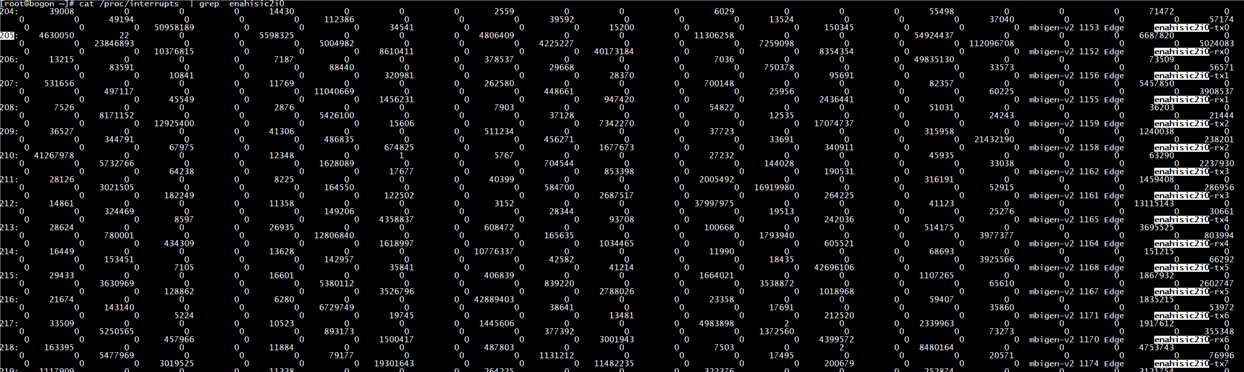
查看网卡中断亲和性

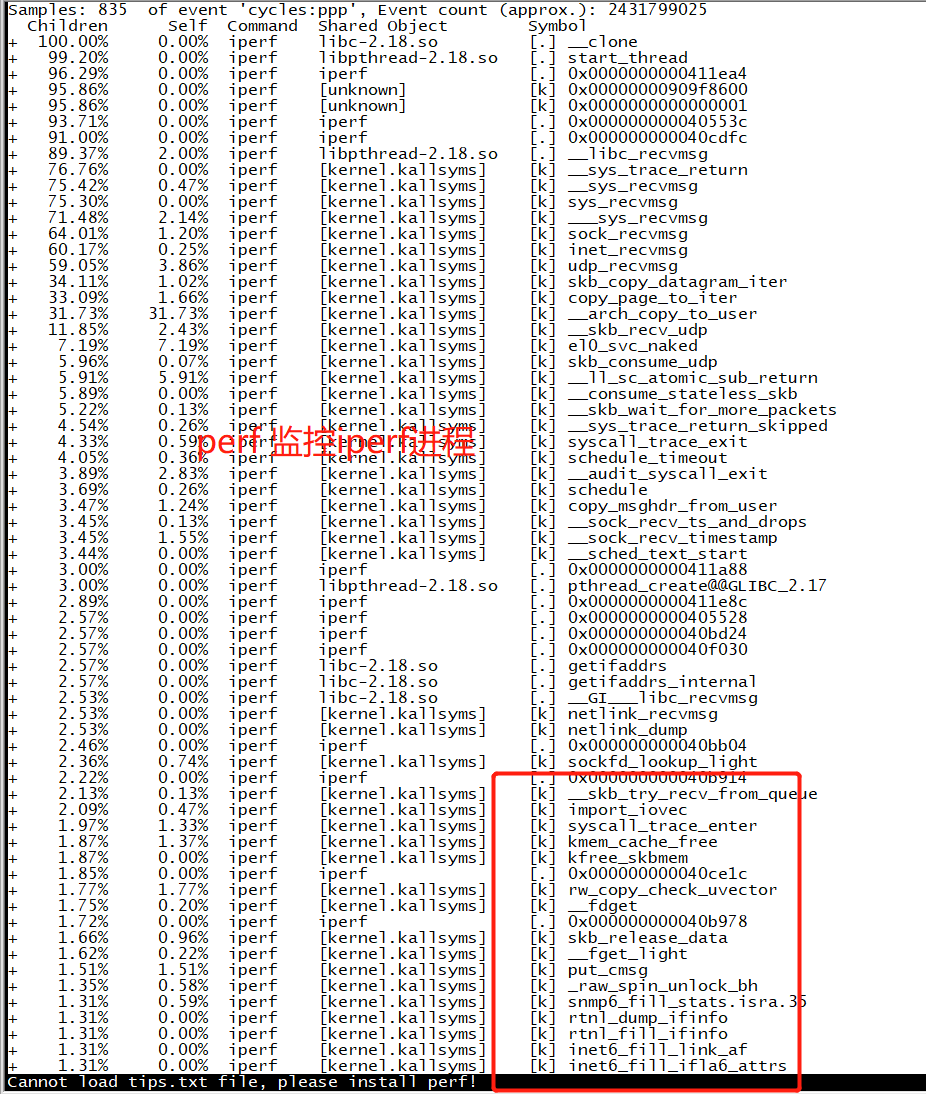
VM001: 通过如下方式采集信息(采集原理见上)
perf record -F 1000 -a -g -p 162 -- sleep 60
发送 UDP 数据报文
iperf -c 10.254.2.161 -i 1 -P 10 -t 10 -u -b 1000M
|
1
|
perf script -i /root/perf.data | ./stackcollapse-perf.pl | ./flamegraph.pl > output.svg
|

原文:https://www.cnblogs.com/dream397/p/14790589.html