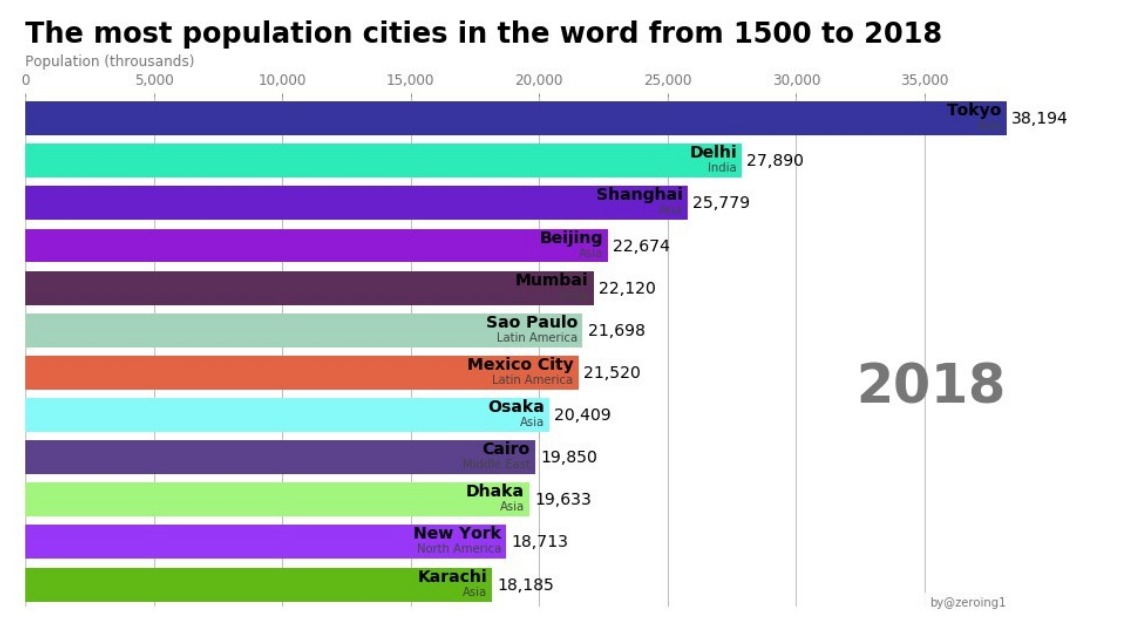
啰嗦了这么多,正式开始本期技术案例分享,关于动态排序图制作之前分享过一篇文章,用的是 matplolib 的 animation 函数,感兴趣的可以看下
基本功能是实现了,但最终效果并不那么友好,这种方法制图的基本原理就是先把数据借助 Matplotlib 可视化为每一帧图片,再将每一帧拼接为视频,缺点很明显:步骤繁琐、代码量多,可视化效果差
今天分享另外一种方法,制作此类状态图,用到的是一个 Github 项目 anichart,众所周知目前如果想做一些丝滑流畅的可视化交互效果,javascripts 是必不可缺少的,而这个项目主要是用 typescript 实现,项目是由一个 B 站 Up主【Jannchie见齐】维护
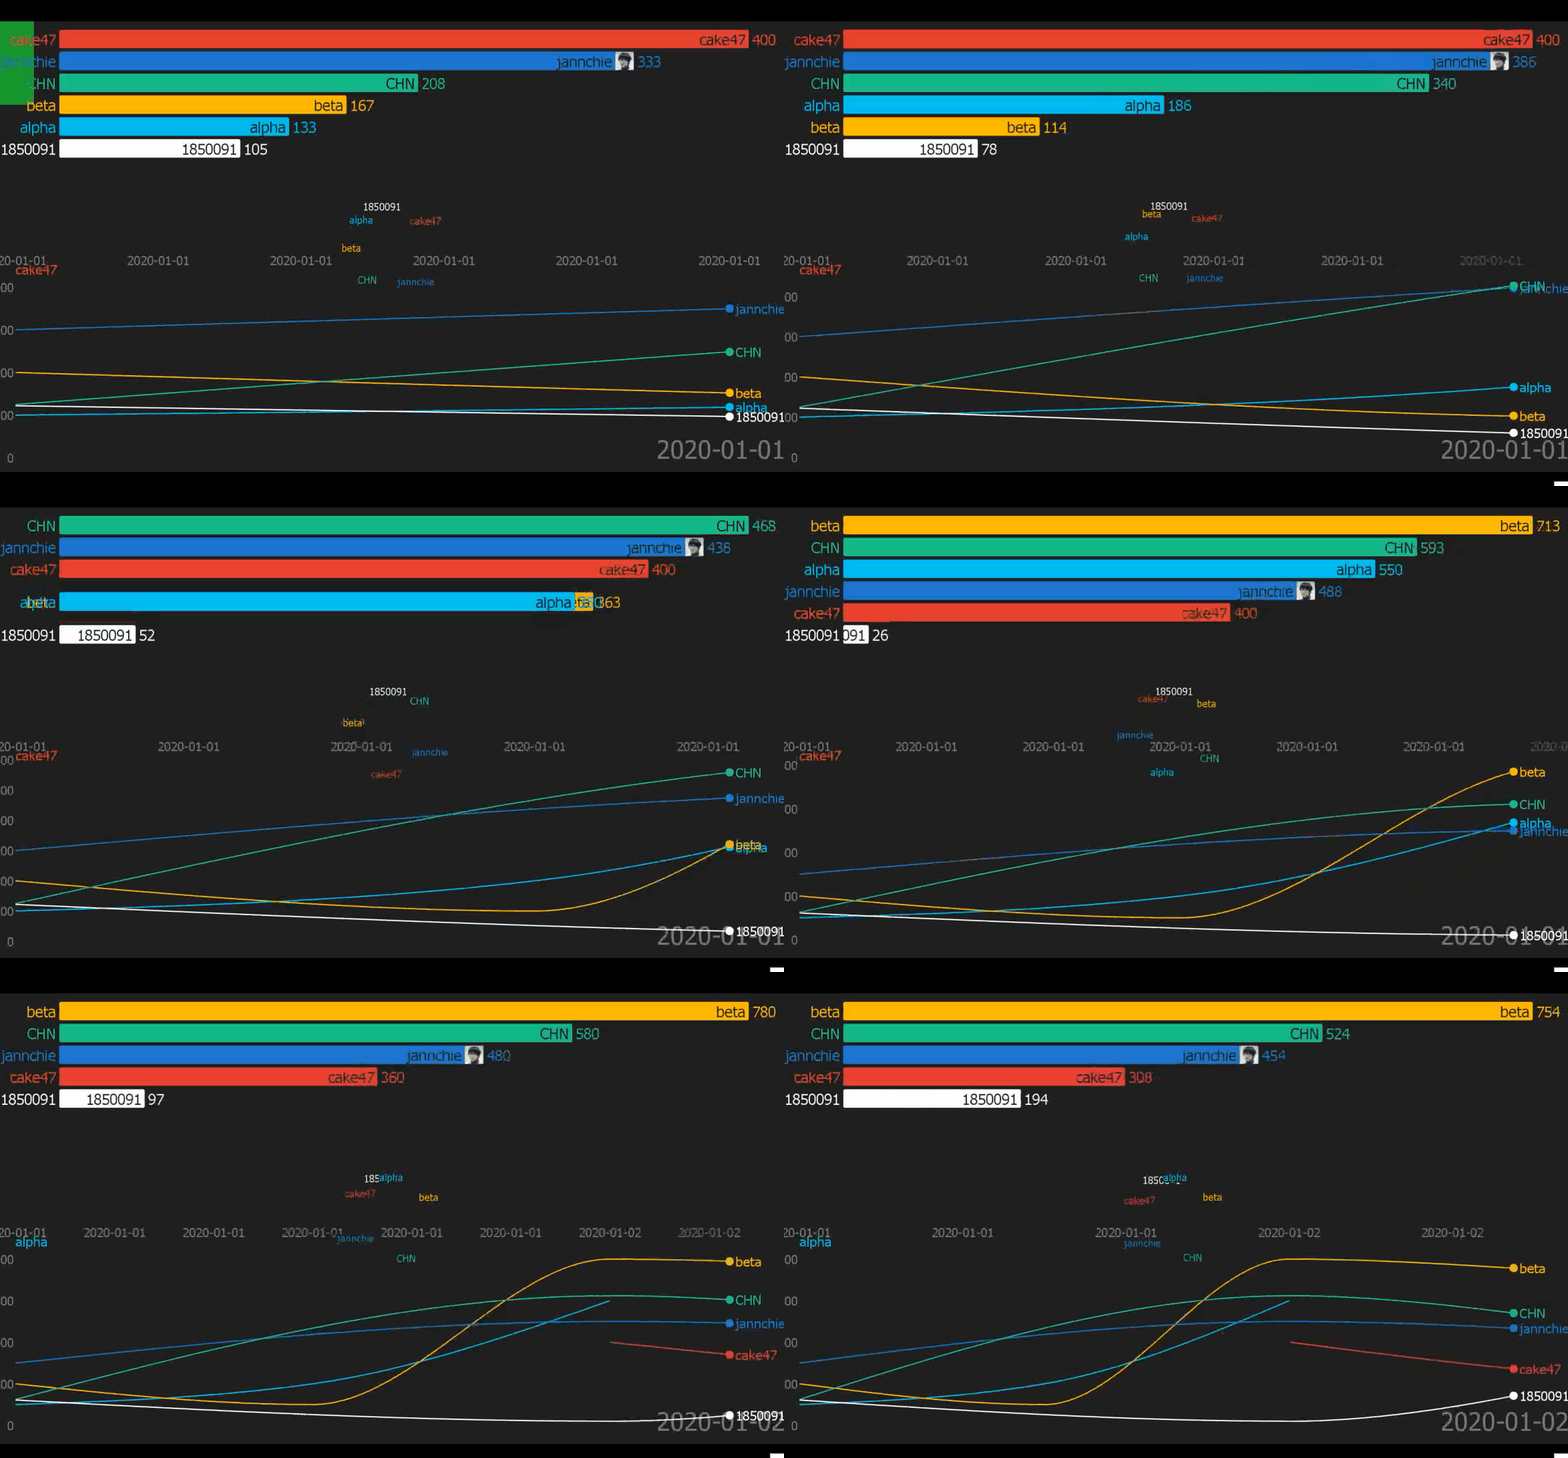
typescript 语言是基于 js 开发的一门编程语言,为了弥补后者可维护性差、类型混乱等缺点;anichart 的主要功能是来制作动态排序图,可视化效果要好得多,下面是我根据针对项目中提供的测试数据最终绘制的排序图,
 ]
]
先交代下本次用到的项目环境,anichart 整体算是一个前端项目,因此本次用到的工具都是一些与前端相关的,本期教程只是介绍给大家这个项目怎么用,关于具体细节不需要去考虑,所以无需担心自己是否具备前端知识;
需要用到的软件如下:
测试系统为 Win10;
Node.js 在这里主要有两个作用:1,管理下载项目所需要的一些依赖项,2,启动 js 脚本;
ffmpeg 主要是将序列图片转化为视频
关于 node.js 与 ffmpeg 在 windows下载安装方式比较简单,这里不多做介绍啦,这里给大家推荐两个链接可以参考下:
Node.js 安装:https://www.jianshu.com/p/2958fc051bfb
ffmpeg 安装:https://zhuanlan.zhihu.com/p/118362010
两个软件安装好之后,不要忘记配置环境变量~
3.1 anichart安装
anichart 作者已经把上传至 npm 官网中,打开命令行,借助 npm i anichart 命令即可安装,不需要我们再从 Github 上克隆,

npm是什么东东?npm其实是Node.js的包管理工具(package manager),也就是说你配置好 Node.js 命令之后,npm 就可以正常使用了
3.2 新建一个 js文件
安装完之后,接下来就能使用了,在anichart 安装路径下 新建一个 js 文件,文件名可任意命名,然后把下面代码添加到刚刚建立的 js 文件
const ani = require(‘anichart‘)
const stage = new ani.Stage()
stage.options.fps = 24
stage.options.sec = 30
stage.output = false

const bgAni = new ani.RectAni()
bgAni.component.shape = {
  width: stage.canvas.width,
  height: stage.canvas.height,
}
bgAni.component.fillStyle = ‘#1e1e1e‘

const textLinesAni = new ani.TextLinesAni()

textLinesAni.component.fillStyle = ‘#eee‘
textLinesAni.component.textAlign = ‘center‘
textLinesAni.component.textBaseline = ‘middle‘
textLinesAni.component.position = {
  x: stage.canvas.width / 2,
  y: stage.canvas.height / 2,
}

const textAnichart = new ani.TextAni()
textAnichart.component.fontSize = 48
textAnichart.component.font = ‘Sarasa Mono Slab SC‘
textAnichart.component.text = ‘Anichart‘
textAnichart.component.fontWeight = ‘bolder‘
textAnichart.type = ‘blur‘


textLinesAni.children.push(textAnichart)


ani.recourse.loadImage(‘H:/Data/data/ANI.png‘, ‘logo‘)
ani.recourse.loadImage(
  ‘https://avatars3.githubusercontent.com/u/29743310?s=460&u=8e0d49b98c35738afadc04e70c7f3918d6ad8cdb&v=4‘,
  ‘jannchie‘
)

ani.recourse.loadCSV(‘H:/Data/data/test.csv‘, ‘data‘)


const rectAni = ani.createAni(
  [
    new ani.Rect({
      position: { x: 100, y: 0 },
      shape: { width: 100, height: 0 },
      fillStyle: ‘#d23‘,
    }),
    new ani.Rect({
      shape: { width: 100, height: 200 },
      fillStyle: ‘#2a3‘,
      alpha: 1,
    }),
    new ani.Rect({
      shape: { width: 100, height: 0 },
      fillStyle: ‘#569‘,
      alpha: 0,
    }),
  ],
  [0, 1, 2],
  ani.ease.easeElastic
)

const logoCenter = new ani.Image({
  path: ‘H:/Data/data/ANI.png‘,
  position: {
    x: stage.canvas.width / 2,
    y: stage.canvas.height / 2,
  },
  alpha: 0.25,
  center: { x: 128, y: 128 },
  shape: { width: 256, height: 256 },
})
const logoAni = ani.createAni(
  [
    new ani.Image({
      path: ‘H:/Data/data/ANI.png‘,
      position: {
        x: 0,
        y: stage.canvas.height - 108,
      },
      shape: { width: 128, height: 128 },
    }),
    new ani.Image({
      path: ‘H:/Data/data/ANI.png‘,
      position: {
        x: stage.canvas.width - 128,
        y: stage.canvas.height - 108,
      },
      shape: { width: 128, height: 128 },
      alpha: 1.0,
    }),
    new ani.Image({
      path: ‘H:/Data/data/ANI.png‘,
      position: {
        x: stage.canvas.width - 128,
        y: stage.canvas.height - 108,
      },
      shape: { width: 128, height: 128 },
      alpha: 0,
    }),
  ],
  [0, 1, 2],
  ani.ease.easeBounce
)

const barChart = new ani.BarChart({
  shape: { width: stage.canvas.width, height: stage.canvas.height },
  labelFormat(id) {
    return id
    // return meta.get(id).name;
  },
  aniTime: [0, 30],
})

const lineChart = new ani.LineChart({
  aniTime: [0, 30],
  shape: { width: stage.canvas.width, height: stage.canvas.height / 2 },
  position: { x: 0, y: stage.canvas.height / 2 },
})


stage.addChild(bgAni)
// stage.addChild(a)
stage.addChild(logoCenter)
stage.addChild(textLinesAni)
stage.addChild(rectAni)
stage.addChild(logoAni)
stage.addChild(barChart)
stage.addChild(lineChart)


const pie = new ani.PieChart({
  aniTime: [0, 30],
  radius: [80, 120],
  position: { x: stage.canvas.width / 2, y: stage.canvas.height / 2 },
})

stage.addChild(pie)
stage.play()
运行之前,需要改几个参数,第一个更改数据路径
ani.recourse.loadCSV(‘H:/Data/data/test.csv‘, ‘data‘)
数据形式需以下面形式存放,后面 data 代表数据源中更改的列名,比如这里是以日期作为变量进行序列化
name,date,value,channel,other
Jannchie,2020-01-01,1,科技,other
Jannchie,2020-01-03,6,科技,other
Jannchie,2020-01-05,3,科技,other
Jannchie,2020-01-07,-,科技,other
Jannchie,2020-01-09,7,科技,other
Jannchie,2020-01-12,12,科技,other
Cake47,2020-01-03,10,生活,other
Cake47,2020-01-02,5,生活,other
Cake47,2020-01-06,2,生活,other
Cake47,2020-01-09,3,生活,other
Cake47,2020-01-11,4,生活,other
第二个需要更改一下所有 png 路径,改成你自己的,可以随意替换为你的 图片路径,影响不大
ani.recourse.loadImage(‘H:/Data/data/ANI.png‘, ‘logo‘)
3.2 运行 js 脚本
以上修改完之后,接下来就是启动脚本,在 js 同文件目录下打开一个命令行,输入 node XXX.js ,回车即可,XXX.js 代表你的 js 文件,效果如下
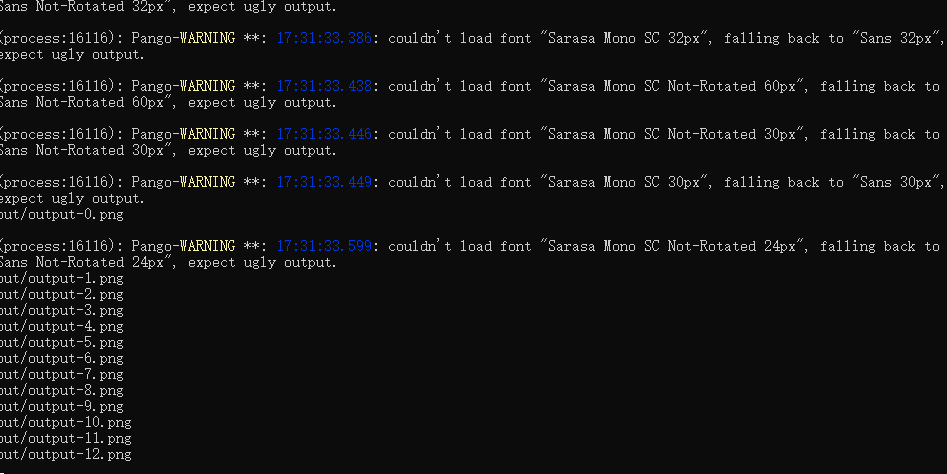
之后会有一个out 文件夹生成,里面存放的就是 anichart 绘制好的图片

3.3 借助ffmpeg图片生成视频
最后,进入out 文件夹,借助ffmpeg 命令将图片合成视频,
ffmpeg -f image2 -framerate 12 -i output-%d.png foo.avi
-framerate 后面参数 12 代表生成视频的fps,可 根据自己情况设定,这里我设置的是 24;
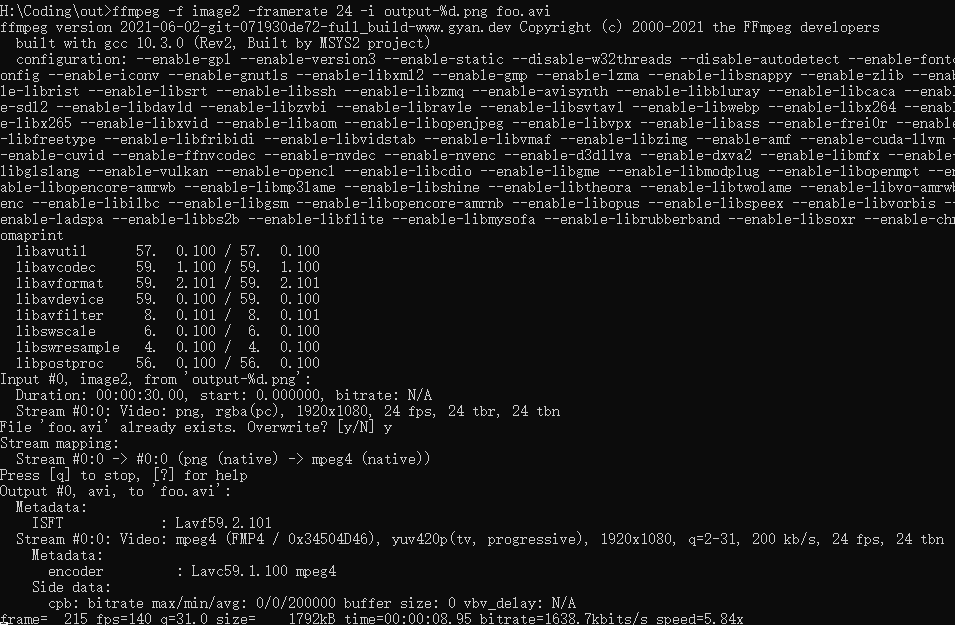
最终一个动态排序视频就生成了,随后自己也可以加一些 bgm 给视频加一些 feel

关于 anichart 的使用,原作者并没有介绍太多,Github 主页上只介绍了最简单的使用方法

因此为了大家生成一些比较不错的可视化图,对上面 js 代码中的部分参数做一些简单介绍,增加一些对这个 anichart 库的理解
4.1 fps、sec
stage.options.fps = 24
stage.options.sec = 30
fps 顾名思义就是一秒多少帧,sec 代表生成切片持续多长时间(单位:秒);用上面参数来设定的话,会生成 24x30 = 720 张图片;这两个参数决定最终视频的流畅度,后面用 ffmpeg 生成视频时,建议 framerate 参数 fps保持 一致
4.2 ani.recourse.loadImage
ani.recourse.loadImage(
  ‘https://avatars3.githubusercontent.com/u/29743310?s=460&u=8e0d49b98c35738afadc04e70c7f3918d6ad8cdb&v=4‘,
  ‘jannchie‘
)
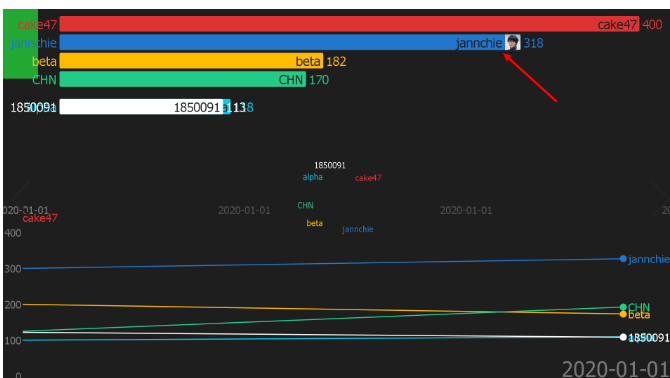
loadImage用来给柱状图中每个数据条上加一个 图片 logo,方法需要加入两个参数,前者表示图片路径或网页链接,后者表示需要加logo 的数据条名字,例如这里选择的数据条名字为 jannchie,可视化效果如下
4.3 BarChart、LineChart、PieChart
BarChart、LineChart、PieChart 分别表示柱状图、曲线图、饼图;anichart 除了这三类图形外还有 ItemChart、BaseChart、MapChart 等,
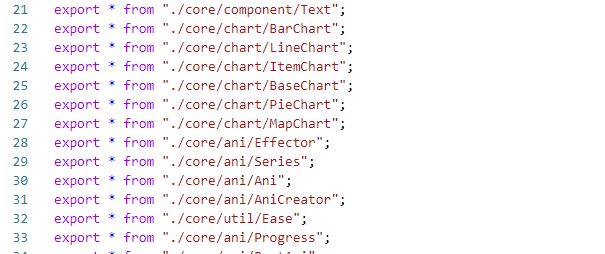
anichart 在所有图形对象中,都需要加入两个参数,shape 和 aniTime,前者代表形状大小、后者表示该图形持续时间,单位 s
4.4 stage.addChild(xx)
anichart 通过 stage.addChild() 函数使得创建的对象生效 ,stage 表示全局 画布,通过以下命令生成
const ani = require(‘anichart‘)
const stage = new ani.Stage()
为了方便,本文中涉及到的源码、测试数据已经被我打包在一起了,获取方式:在公众号 小张Python 后台,回复关键字:210604 即可获取
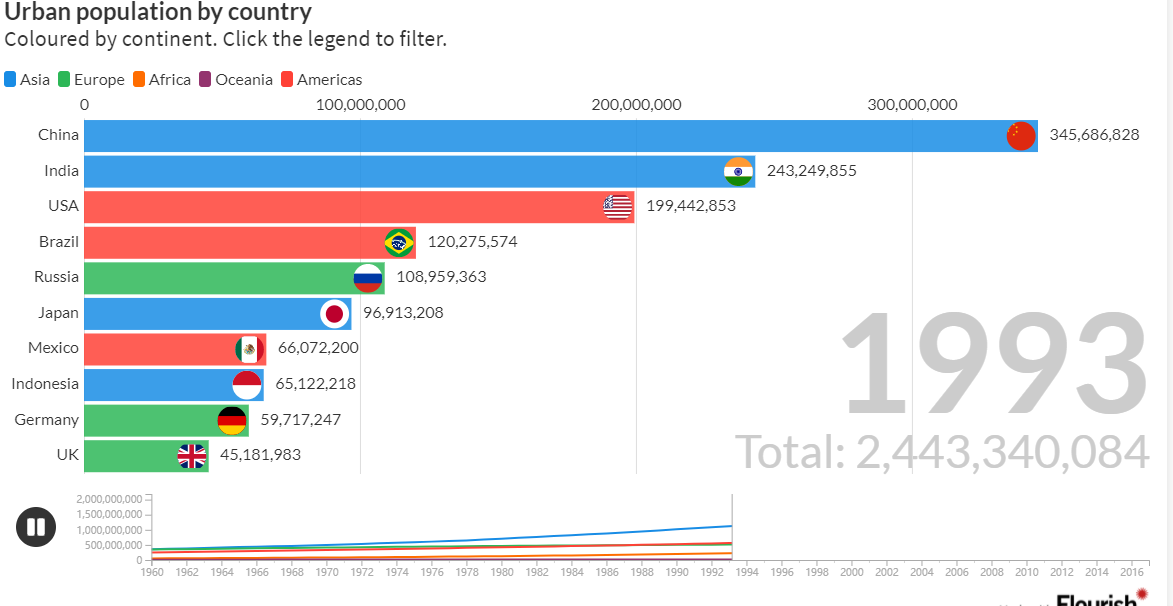
关于动态排序图制作除了这两种方法之外,再向大家推荐一个网站名叫 flourish,网址:https://flourish.studio/examples/
flourish 最终生成效果也非常不错,但缺点是需要微调大量参数
好了,关于排序图的制作就介绍到这里了,如果内容对你有帮助的话不妨点个赞来鼓励一下我~
最后感谢大家的阅读,我们下期见
如何绘制好看的动态排序图,教你用 js包 anichart 来实现!
原文:https://www.cnblogs.com/zeroing0/p/14854337.html