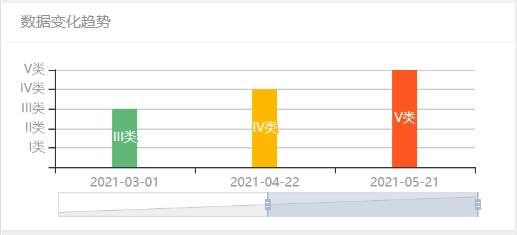
var myChart = echarts.init(document.getElementById(‘chrats‘));

var color = [0, ‘#1E9FFF‘, ‘#009688‘, ‘#5FB878‘, ‘#FFB800‘, ‘#FF5722‘];

var yData = [‘2021-01-01‘, ‘2021-02-01‘, ‘2021-03-01‘, ‘2021-04-22‘, ‘2021-05-21‘];
var xData = [1, 2, 3, 4, 5];

function makeValue(value)
{
    if(typeof(value) == ‘object‘)
    {
        value = value.value;
    }

    var texts = [];

    if (value <= 0)
    {
        texts.push(‘‘);
    }
    else if (value <= 1)
    {
        texts.push(‘I类‘);
    }
    else if (value <= 2)
    {
        texts.push(‘II类‘);
    }
    else if(value <= 3)
    {
        texts.push(‘III类‘);
    }
    else if(value <= 4)
    {
        texts.push(‘IV类‘);
    }
    else
    {
        texts.push(‘V类‘);
    }

    return texts;
}

var option =
{
    grid:
    {
        left: 27,
        top: 12,
        right: 17,
        bottom: 40,
    },
    tooltip:
    {
        show: true,
        trigger: ‘axis‘,
        formatter: function(param)
        {
            var value = param[0];
            var text = ‘<span style="color: ‘ + value.color + ‘;">‘ + makeValue(param) + ‘</span>‘;

            return ‘<span style="font-size: 10px;">‘ + value.axisValueLabel + ‘: ‘ + text + ‘</span>‘;
        }
    },
    dataZoom:
    [
        {
            type: "slider",
            show: true,
            height: 20,
            bottom: 0,
            xAxisIndex: [0]
        },
        {
            type: ‘inside‘,
            realtime: true
        }
    ],
    xAxis:
    {
        type: ‘category‘,
        data: yData,
        axisLabel:
        {
            textStyle:
            {
                color: ‘#939393‘,
                fontSize: 10
            }
        }
    },
    yAxis:
    {
        type: ‘value‘,
        min:0,
        max:5,
        axisLabel:
        {
            color: ‘#939393‘,
            fontSize: 10,
            formatter: makeValue
        }
    },
    series:
    [
        {
            type: ‘bar‘,
            barWidth : 20,
            data: [],
            label:
            {
                show: true,
                position: ‘inside‘,
                fontSize: 10,
                formatter: makeValue
            },
            itemStyle:
            {
                normal:
                {
                    // barBorderRadius: [10, 10, 0, 0]
                }
            }
        }
    ]
};

for(i in xData)
{
    option.series[0].data.push(
    {
        value: xData[i],
        itemStyle:
        {
            color: color[xData[i]]
        }
    });
}

myChart.setOption(option);

setTimeout(function()
{
    option.dataZoom[0].startValue = xData.length - 3;
    myChart.setOption(option, 1);
}, 500)
原文:https://www.cnblogs.com/XiaoMingBlingBling/p/14858233.html