fig = plt.gca()	# 获取当前的Figure对象,如果没有就新建一个Figure

# 保存统计图
fig.savefig(‘figure.pdf‘, dpi=fig.dpi, format=‘pdf‘, pad_inches=0,bbox_inches=‘tight‘)
api路径:matplotlib.figure.Figure.savefig(self, fname, *, transparent=None, **kwargs)
import matplotlib.pyplot as plt
plt.ion() # 交互模式
fig, ax = plt.subplots() # 创建画布
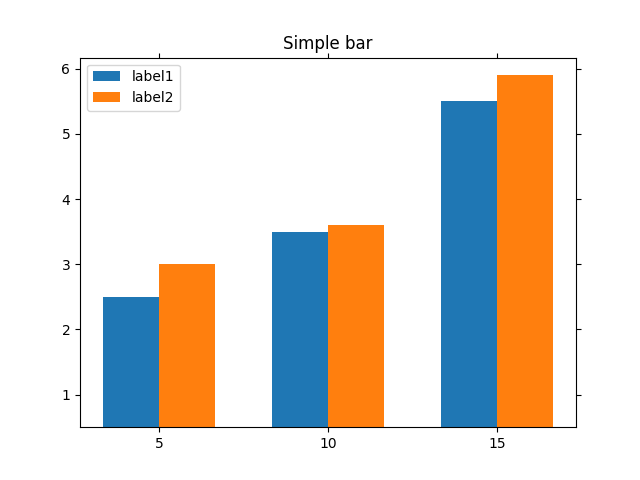
ax.set_title(‘Simple bar‘) # 设置标题
# 创建条形图
label1 = ax.bar(
x = [1, 1.6, 2.2],
height = [2, 3, 5],
width = 0.2,
bottom = 0.5,
align = ‘edge‘,
)
label1.set_label(‘label1‘)
label2 = ax.bar(
x = [1.2, 1.8, 2.4],
height = [2.5, 3.1, 5.4],
width = 0.2,
bottom = 0.5,
align = ‘edge‘,
)
label2.set_label(‘label2‘)
ax.bar(
x = [1.2, 1.8, 2.4],
height = [0, 0, 0],
width = [0, 0, 0],
align = ‘center‘,
tick_label = [‘5‘, ‘10‘, ‘15‘]
)
ax.legend([label1, label2], [‘label1‘, ‘label2‘]) # 自动创建图例
ax.clear() # 清除所有
原文:https://www.cnblogs.com/lfywork/p/14897379.html