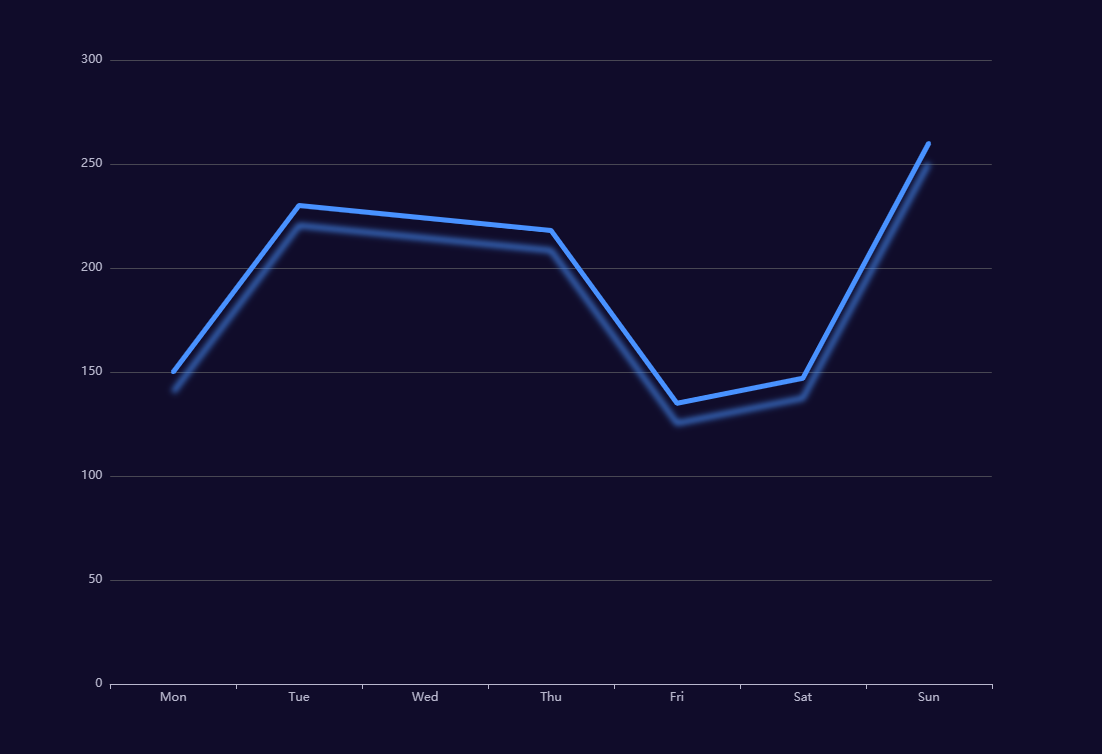
var myChart = echarts.init(document.getElementById(‘main‘));
// 指定图表的配置项和数据
var option = {
  legend: {
    data: [‘高度(km)与气温(°C)变化关系‘]

  },
  tooltip: {
    trigger: ‘axis‘,
    formatter: ‘Temperature : <br/>{b}km : {c}°C‘
  },
  grid: {
    left: ‘3%‘,
    right: ‘4%‘,
    bottom: ‘3%‘,
    containLabel: true
  },
  xAxis: {
    type: ‘value‘,
    axisLabel: {
      formatter: ‘{value} °C‘
    }
  },
  yAxis: {
    type: ‘category‘,
    axisLine: { onZero: false },
    axisLabel: {
      formatter: ‘{value} km‘
    },
    boundaryGap: false,
    data: [‘0‘, ‘10‘, ‘20‘, ‘30‘, ‘40‘, ‘50‘, ‘60‘, ‘70‘, ‘80‘]
  },
  series: [
    {
      name: ‘高度(km)与气温(°C)变化关系‘,
      type: ‘line‘,
      smooth: true,
      lineStyle: {
        width: 5,
        shadowColor: ‘rgba(73,146,255,0.8)‘,
        shadowBlur: 6,
        shadowOffsetY: 20
      },
      data: [15, -50, -56.5, -46.5, -22.1, -2.5, -27.7, -55.7, -76.5]
    }
  ]
};
if (option && typeof option === "object") {
  myChart.setOption(option, true);
}
原文:https://www.cnblogs.com/zk12138/p/14927392.html