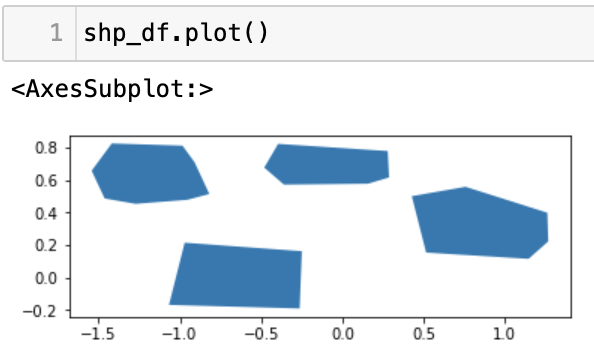
import shapely, geopandas
tpath = ‘D:/shapefile/province.shp‘

shp_df = geopandas.GeoDataFrame.from_file(tpath,encoding = ‘gb18030‘)

shp_df.head()    # 获取表头
shp_df.plot()
输出:
	id	geometry
0	0	POLYGON ((-1.41816 0.82393, -0.98349 0.81018, ...
1	1	POLYGON ((-0.39477 0.82118, 0.27923 0.77717, 0...
2	2	POLYGON ((0.75791 0.55708, 1.26135 0.39752, 1....
3	3	POLYGON ((-0.96974 0.21320, -0.24897 0.16094, ...
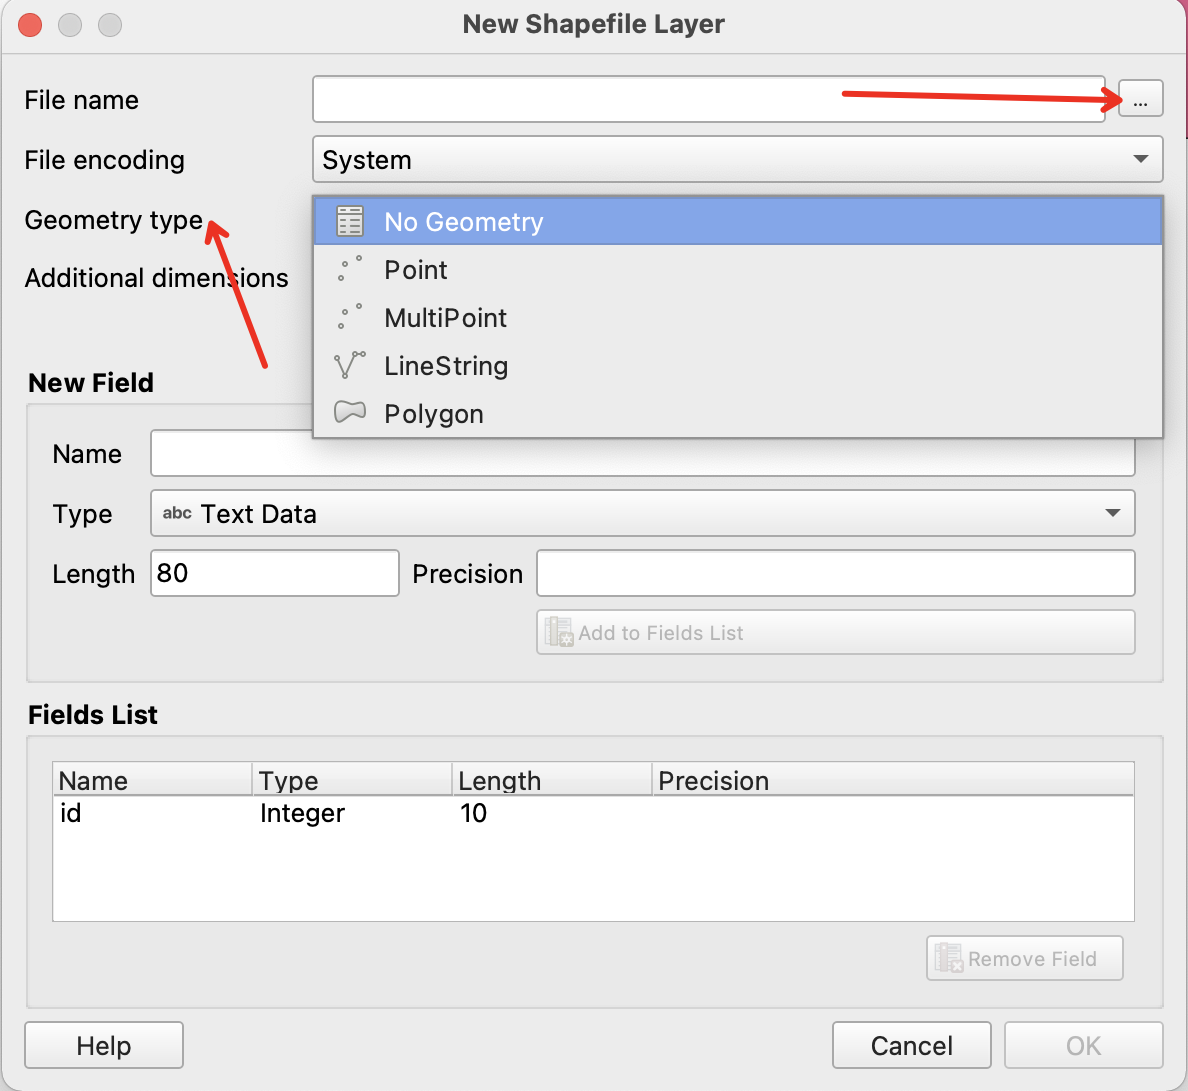
【582】QGIS 矢量化 & Python 加载 shapefile
原文:https://www.cnblogs.com/alex-bn-lee/p/14946174.html