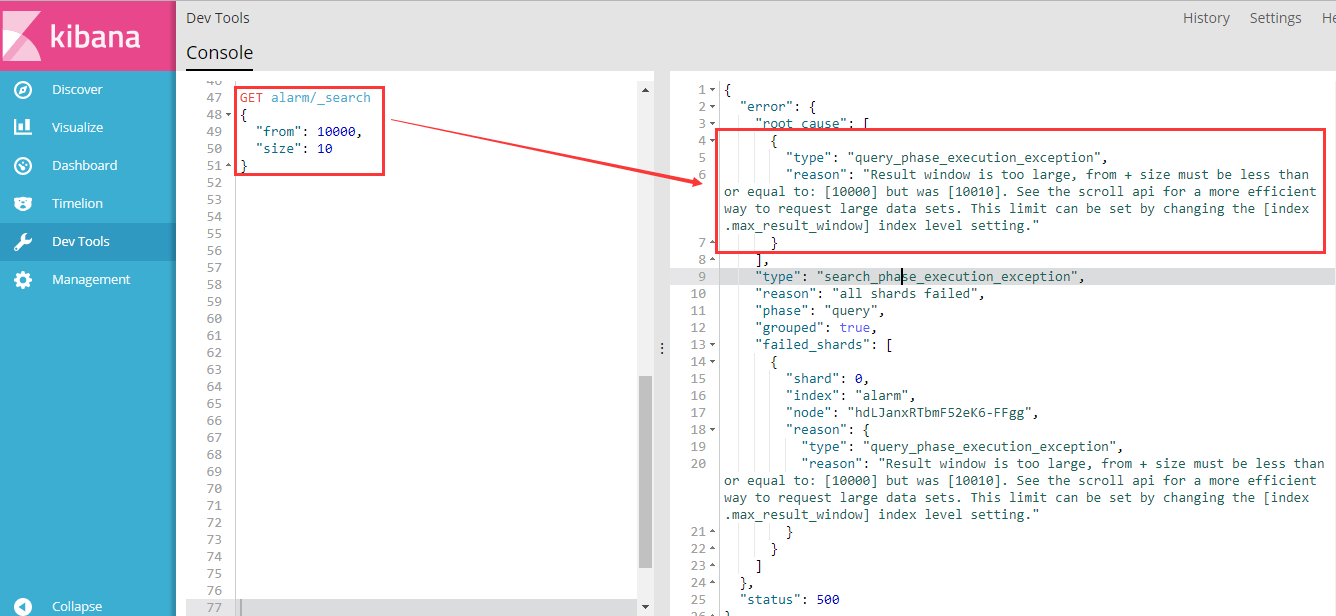
分页查询场景,当查询记录数超过 10000 条时,会报错。
使用 Kibana 的 Dev Tools 工具查询 从第 10001 条到 10010 条数据。
查询语句如下:
GET alarm/_search
{
  "from": 10000,
  "size": 10
}
查询结果,截图如下:

报错信息如下:
{
  "error": {
    "root_cause": [
      {
        "type": "query_phase_execution_exception",
        "reason": "Result window is too large, from + size must be less than or equal to: [10000] but was [10010]. See the scroll api for a more efficient way to request large data sets. This limit can be set by changing the [index.max_result_window] index level setting."
      }
    ],
    "type": "search_phase_execution_exception",
    "reason": "all shards failed",
    "phase": "query",
    "grouped": true,
    "failed_shards": [
      {
        "shard": 0,
        "index": "alarm",
        "node": "hdLJanxRTbmF52eK6-FFgg",
        "reason": {
          "type": "query_phase_execution_exception",
          "reason": "Result window is too large, from + size must be less than or equal to: [10000] but was [10010]. See the scroll api for a more efficient way to request large data sets. This limit can be set by changing the [index.max_result_window] index level setting."
        }
      }
    ]
  },
  "status": 500
}
Elasticsearch 默认查询结果最多展示前 10000 条数据。
按照报错信息里的提示,可以看到,通过设置 max_result_window 的值来调整显示数据的大小:
This limit can be set by changing the [index.max_result_window] index level setting.
两种方式可以实现:
修改Elasticsearch 集群中的 配置文件 config/elasticsearch.yml
在配置文件最后增加一行,如下:
max_result_window: 200000000
具体操作命令,如下(比如,设置可查询 200000000 条数据,其中 alarm 是index名称):
PUT alarm/_settings
{
  "max_result_window" : 200000000
}
命令执行效果,截图如下:

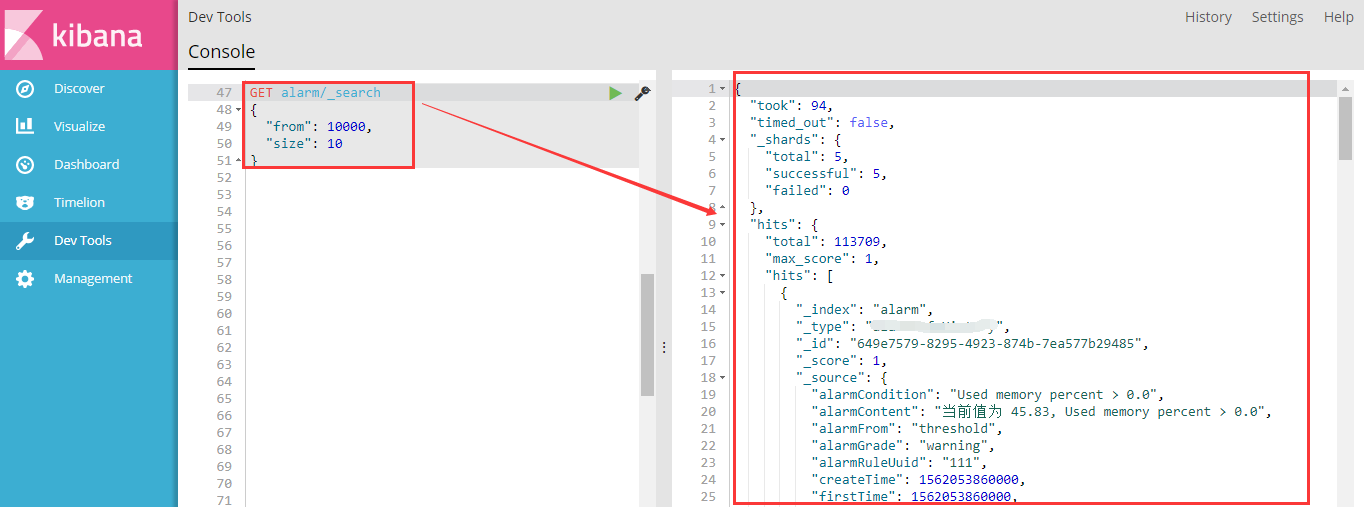
再次执行查询语句,即可正常查询,效果截图如下:

文章来源:https://www.cnblogs.com/miracle-luna/p/11153088.html
解决 Elasticsearch 超过 10000 条无法查询的问题
原文:https://www.cnblogs.com/xzlive/p/15094920.html