记录一下折线图学习成果,效果非常捧,在2个点之间还可以动画过渡,虽然在项目中没有使用上(数据量大,频繁添加点时,刷新慢;动态更新所有点的x坐标位置时,甚至出现程序卡死)
通过示例代码,可以学习到 ChartView 中使用 LineSeries/ValueAxis 画折线图的基本用法:
1. 修改坐标轴样式:字体,颜色,如何去掉文字,设置显示范围,显示格数等
2. QML 中定时器的用法
3. 其它:Array 用法
  1 import QtQuick 2.0
  2 import QtCharts 2.2
  3
  4 ChartView {
  5     id: chartView
  6     title: "ChartView"
  7     antialiasing: true
  8     backgroundColor: Qt.rgba(0, 0, 1, 0.1)
  9     animationOptions: ChartView.SeriesAnimations
 10     animationDuration: 1
 11     titleColor: Qt.rgba(0, 0, 0, 0.8)
 12     titleFont.bold: true
 13     titleFont.pointSize: 15
 14     legend.visible: false
 15     margins.left: 10
 16     margins.right: 10
 17     margins.top: 10
 18     margins.bottom: 10
 19
 20     ValueAxis {
 21         id: myAxisX
 22         min: 0
 23         max: 6000
 24         tickCount: 20
 25         labelsColor: Qt.rgba(0, 0, 0, 0.9)
 26         labelsFont.pointSize: 13
 27         labelsFont.bold: true
 28         labelFormat: ‘ ‘
 29         color: Qt.rgba(0, 0, 1, 0.9)
 30     }
 31
 32     ValueAxis{
 33         id: myAxisY
 34         min: 0
 35         max: 60000
 36         tickCount: 6
 37         labelsColor: Qt.rgba(0, 0, 0, 0.9)
 38         labelsFont.pointSize: 13
 39         labelsFont.bold: true
 40         labelFormat: ‘%d‘
 41         color: Qt.rgba(0, 0, 1, 0.9)
 42     }
 43
 44     LineSeries {
 45         id: lineSeries
 46         name: "LineSeries"
 47         axisX: myAxisX
 48         axisY: myAxisY
 49         color: Qt.rgba(1, 0, 0, 1)
 50         width: 1
 51     }
 52
 53     // FIXME 2021-08-07 : timer for test
 54     Timer {
 55         running: true
 56         interval: chartView.animationDuration
 57         repeat: true
 58
 59         property int current: 0
 60         property int xValue: 0
 61         property var valueList: new Array
 62
 63         Component.onCompleted: {
 64             valueList.push(10000)
 65             valueList.push(15000)
 66             valueList.push(25000)
 67             valueList.push(30000)
 68             valueList.push(35000)
 69             valueList.push(40000)
 70             valueList.push(45000)
 71             valueList.push(49700)
 72             valueList.push(49800)
 73             valueList.push(49900)
 74             valueList.push(49950)
 75             valueList.push(50000)
 76             valueList.push(49950)
 77             valueList.push(49900)
 78             valueList.push(49800)
 79             valueList.push(49700)
 80             valueList.push(45000)
 81             valueList.push(40000)
 82             valueList.push(35000)
 83             valueList.push(30000)
 84             valueList.push(25000)
 85             valueList.push(15000)
 86             valueList.push(10000)
 87         }
 88
 89         onTriggered: {
 90             var y = valueList[current]
 91             current = current + 1
 92             if (current >= valueList.length) {
 93                 current = 0
 94             }
 95
 96             var x = xValue
 97             xValue += 10
 98             if (xValue >= myAxisX.max) {
 99                 lineSeries.clear()
100                 xValue = 0
101                 return
102             }
103             lineSeries.append(x, y)
104         }
105     }
106 }
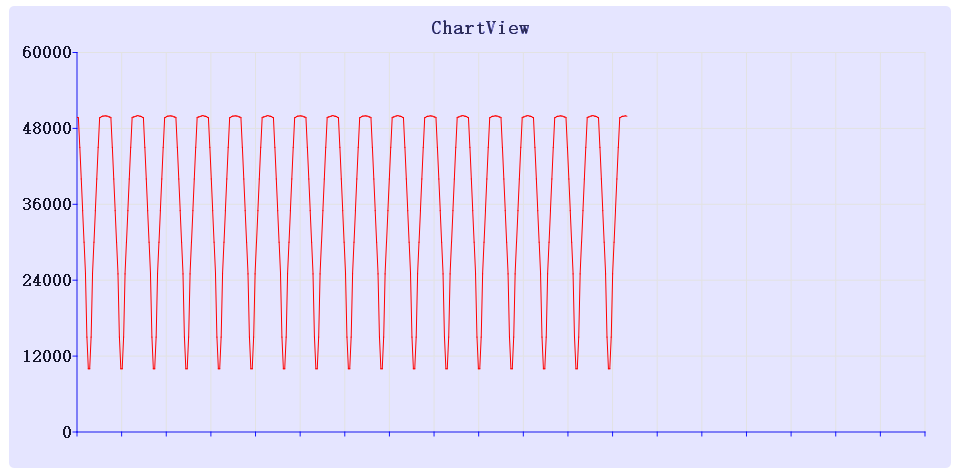
效果图
原文:https://www.cnblogs.com/diysoul/p/15113744.html