首页 > 其他 > 详细

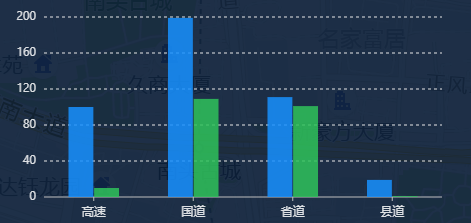
bizcharts分组柱状图

时间:2021-08-08 11:18:50      阅读:30      评论:0      收藏:0      [点我收藏+]

技术分享图片

let indexServiceData = [ {
      "groupType" : "type",
      "typeValue" : "IMSI",
      "高速": 100,
      "国道": 199,
      "省道" : 111,
      "县道": 19
    }, {
      "groupType" : "type",
      "typeValue" : "车牌",
      "高速": 10,
      "国道": 109,
      "省道" : 101,
      "县道": 1
    }]
    const ds = new DataSet();
    const dv = ds.createView().source(indexServiceData);
    dv.transform({
      type: "fold",
      fields: ["高速","国道", "省道", "县道"],
      // 展开字段集
      key: "statusName", // 自定,Chart里面Axis x轴name="statusName"
      // key字段
      value: "totalNumber" // value字段 自定,Chart里面Axios y轴name="totalNumber"
    });
             <Chart
                        padding={[10, 30, 50, 30]}
                        width={460}
                        height={240}
                        data={dv}
                        scale={placeScale}
                        forceFit
                      >
                        <Axis name="statusName"/>
                        <Axis name="totalNumber"/>
                        <Tooltip
                          crosshairs={{
                            type: "y"
                          }}
                        />
                        <Geom
                          type="interval"
                          position="statusName*totalNumber"
                          color={"typeValue"}
                          adjust={[
                            {
                              type: "dodge",
                              marginRatio: 1 / 32
                            }
                          ]}
                        />
                      </Chart>

需要注意的是 key,value可以随意定,但Axios的需要与之相对应

bizcharts分组柱状图

原文:https://www.cnblogs.com/rachelch/p/15113776.html

(0)
(0)
   
举报
评论 一句话评论(0
关于我们 - 联系我们 - 留言反馈 - 联系我们:wmxa8@hotmail.com
© 2014 bubuko.com 版权所有
打开技术之扣,分享程序人生!