Google Chart API 是谷歌提供的一项动态生成图表的服务。你可以随时自定义图表,以适应网站的外观和感觉。图表使用HTML5/SVG技术提供给iPhone手机, iPad和Android的跨浏览器兼容性(包括VML较旧版本的IE )和跨平台的可移植性呈现。
官网地址:https://developers.google.com/chart/?hl=zh-cn
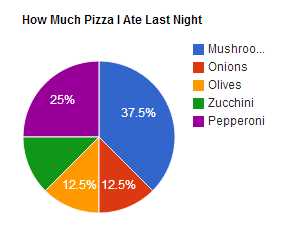
运行下面这段代码,可以动态生成一个漂亮的图表

<html>
  <head>
    <!--Load the AJAX API-->
    <script type="text/javascript" src="https://www.google.com/jsapi"></script>
    <script type="text/javascript">

      // Load the Visualization API and the piechart package.
      google.load(‘visualization‘, ‘1.0‘, {‘packages‘:[‘corechart‘]});

      // Set a callback to run when the Google Visualization API is loaded.
      google.setOnLoadCallback(drawChart);

      // Callback that creates and populates a data table,
      // instantiates the pie chart, passes in the data and
      // draws it.
      function drawChart() {

        // Create the data table.
        var data = new google.visualization.DataTable();
        data.addColumn(‘string‘, ‘Topping‘);
        data.addColumn(‘number‘, ‘Slices‘);
        data.addRows([
          [‘Mushrooms‘, 3],
          [‘Onions‘, 1],
          [‘Olives‘, 1],
          [‘Zucchini‘, 1],
          [‘Pepperoni‘, 2]
        ]);

        // Set chart options
        var options = {‘title‘:‘How Much Pizza I Ate Last Night‘,
                       ‘width‘:400,
                       ‘height‘:300};

        // Instantiate and draw our chart, passing in some options.
        var chart = new google.visualization.PieChart(document.getElementById(‘chart_div‘));
        chart.draw(data, options);
      }
    </script>
  </head>

  <body>
    <!--Div that will hold the pie chart-->
    <div id="chart_div"></div>
  </body>
</html>
效果如下
那么他到底是如何工作的?
绘制chart需要三个库
这三个库通过两个<script>标签引入
<!--Load the AJAX API-->
<script type="text/javascript" src="https://www.google.com/jsapi"></script>
<script type="text/javascript">

  // Load the Visualization API library and the piechart library.
  google.load(‘visualization‘, ‘1.0‘, {‘packages‘:[‘corechart‘]});
  google.setOnLoadCallback(drawChart);
  // ... draw the chart...
</script>
第一个script标签引入了JSAPI库。
第二个script标签引入了谷歌可视化库和chart库,它通常还保存你的chart的代码。
第二个script标签的第一行调用了google.load()函数。这个函数需要以下语法:
google.load(‘visualization‘, ‘1.0‘, {‘packages‘:[<list_of_package_names>]});
visualization 加载google.visualization库。该库定义了所有的核心工具类和函数。
1.0 加载的visualization的版本。 1.0始终是当前的生产版本。
list_of_package_names 在该示例中的‘corechart‘库定义了最基本的图表,包括饼图,条形图和柱形图。如果你要绘制的图表不包含在这个库中,你必须为相应的图表增加一条,作为单独的数组项。该库中被定义。例如每个图表的文档列表,这里是如何加载的核心图表加一个表图表: google.load(‘visualization‘, ‘1.0‘, {‘packages‘:[‘corechart‘,‘table‘]});
准备数据
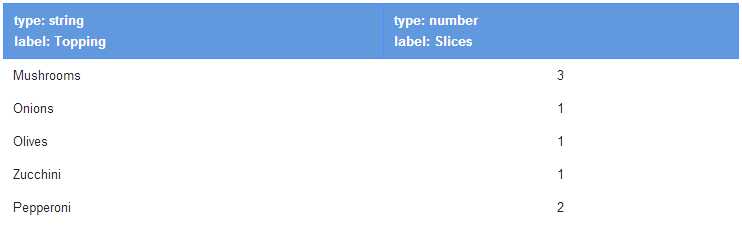
创建一个数据表,使用google.visualization.DataTable类
        // Create the data table.
        var data = new google.visualization.DataTable();
        data.addColumn(‘string‘, ‘Topping‘);
        data.addColumn(‘number‘, ‘Slices‘);
        data.addRows([
          [‘Mushrooms‘, 3],
          [‘Onions‘, 1],
          [‘Olives‘, 1],
          [‘Zucchini‘, 1],
          [‘Pepperoni‘, 2]
        ]);
添加两列,一列类型为string,名称为Topping,另一列类型为number,名称为Slices。
添加五列作为chart的数据
设置chart参数,包括chart的标题、长和宽。
// Set chart options
 var options = {‘title‘:‘How Much Pizza I Ate Last Night‘,
                ‘width‘:400,
                ‘height‘:300};
使用draw函数将图表绘制到指定的元素上
 // Instantiate and draw our chart, passing in some options.
 var chart = new google.visualization.PieChart(document.getElementById(‘chart_div‘));
 chart.draw(data, options);
Google Charts插件(一),布布扣,bubuko.com
原文:http://www.cnblogs.com/couxiaozi1983/p/3575030.html