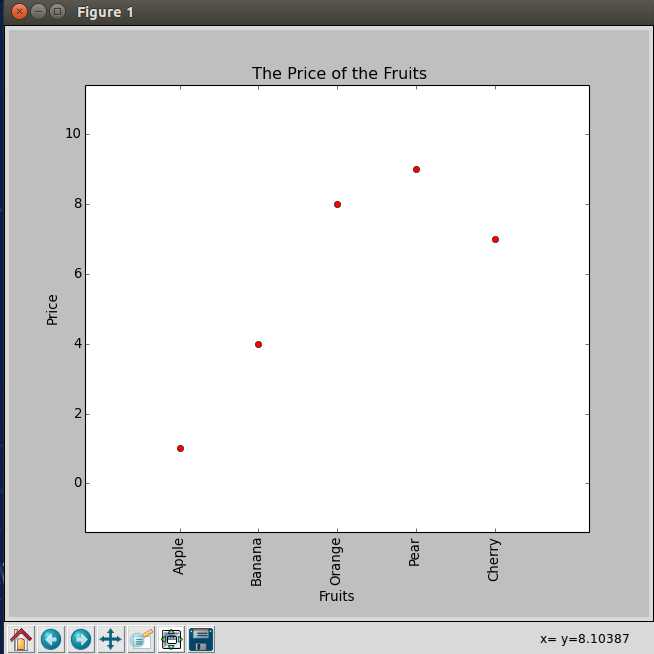
要画出如上图(注意原点有边距),怎么办呢?
简单而优雅,请看代码:
#!/usr/bin/env python
# coding=utf-8

import matplotlib.pyplot as plt


def loadData():
    x = [1,2,3,4,5]
    y = [1,4,8,9,7]
    labelsx = [‘Apple‘,‘Banana‘,‘Orange‘,‘Pear‘,‘Cherry‘]
    return x,y,labelsx

def drawGraph():
    x,y,labels_x = loadData()
    plt.plot(x,y,‘ro‘)
    plt.xticks(x,labels_x,rotation=‘vertical‘)

    plt.xlabel("Fruits")
    plt.ylabel("Price")
    plt.title(" The Price of the Fruits")

    plt.margins(0.3)
    plt.subplots_adjust(bottom=0.15)
    plt.show()

if __name__=="__main__":
    drawGraph()
参考:http://matplotlib.org/examples/index.html
原文:http://www.cnblogs.com/jkmiao/p/4455452.html