https://visualstudiogallery.msdn.microsoft.com/bc561769-36ff-4a40-9504-e266e8706f93
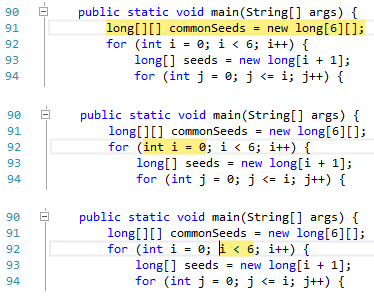
This extension provides basic features for the Java programming language. Current editing features include:
The latest version of this extension also includes an experimental project system and debugger for Java code. More information about these features is included below.
This extension is not meant to replace a full IDE, but has certainly helped when I wanted to quickly reference a Java source file while working within Visual Studio.
Current features of the debugger include:
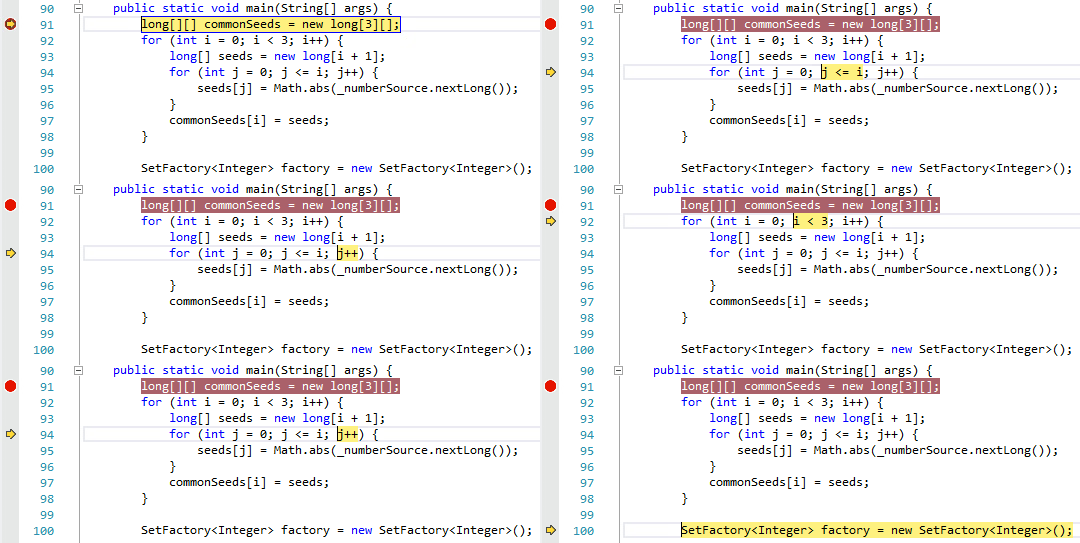
In our opinion, this is hands-down the coolest feature of our debugger.
We’ve been looking, but so far it seems that no current Java IDE can properly distinguish between multiple statements on a single line. We aim to change that.The image below shows a series of steps in the debugger (the Step Over command was executed exactly one time between each image). As you can see, our debugger follows the logical stepping sequence from the initializer to the condition of the for statement.

Here is an animated image showing a more complete example.

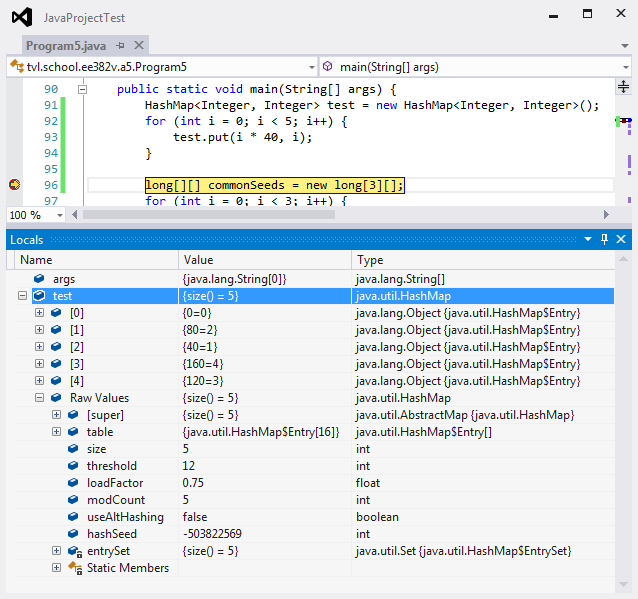
The debugger provides special handling for arrays and classes implementing Collection, Map, and a few other interfaces. To ensure that the debugger doesn’t restrict access to information you need, a special Raw Values property is provided which the user can expand to see the object’s true internal structure. Direct access to the Static Members of classes is provided as well (standard for all classes).

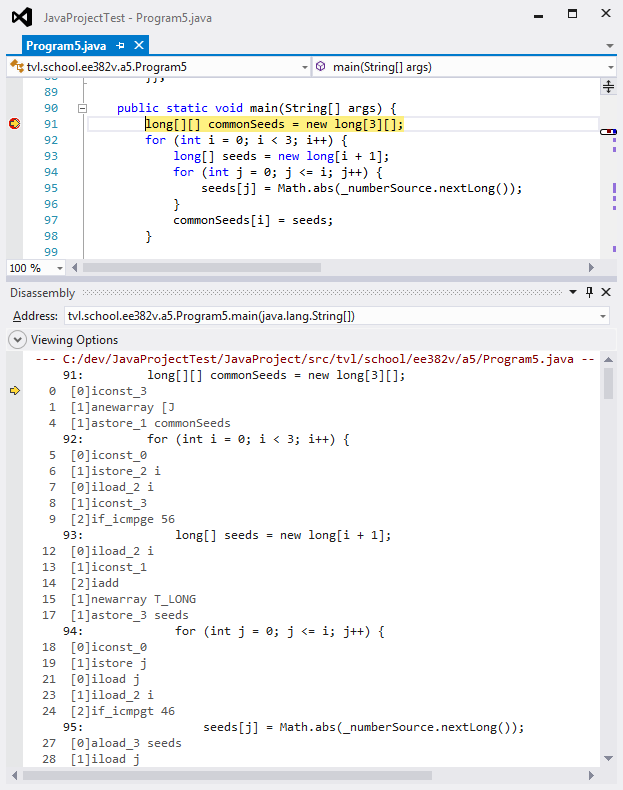
Curious about what your code is compiling to? The disassembly window fully supports Java bytecode while debugging your program.

The Java debugger extends the Debug → Exceptions window with support for Java Runtime Environment exceptions.
Handling behavior for exceptions may be configured by package or by individual exception type. The following example shows a user configuration requesting the debugger stop immediately when an IllegalArgumentException is thrown.
When an exception is thrown, the debugger first checks to see if the user has requested the debugger stop when the exception is thrown. In this case, we configured the debugger to stop when an IllegalArgumentException is thrown, whether or not a catch statement is available to handle the exception.
If an exception is thrown and no exception handler is available to handle the exception, the debugger stops immediately at the point the unhandled exception is thrown. The user does not need to specially configure the debugger to respond to this error case.
The following image shows the contents of many (but not all) of the currently supported debugger windows in Visual Studio.
This should be considered a preview release of the new features of this extension.
This should be considered an early preview release of the new features of this extension.
This should be considered an early preview release of the new features of this extension.
原文:http://www.cnblogs.com/mingyongcheng/p/4555660.html