脚本程序:
#Add data file
fn = ‘D:/Temp/hdf/FY2C_CLC_MLT_NOM_20070730_1800.hdf‘
f = addfile(fn)
#Get data variable
v = f[‘FY2C_Hourly_Cloud_Classification‘]
#Set x/y
x = linspace(-5750000.0,5750000.0, 2288)
y = linspace(-5750000.0,5750000.0, 2288)
#Add x/y dimensions
v.setdim(‘Y‘, y, 0)
v.setdim(‘X‘, x, 1)
#Get data array
cloud = v[:,:]
#Plot
ax, proj = axesm(proj=‘geos‘, lon_0=104.5, h=35785864, gridlabel=True, gridline=True, frameon=False)
mlayer = shaperead(‘D:/Temp/map/country1.shp‘)
geoshow(mlayer, edgecolor=(0,0,255))
cols = makecolors(10, cmap=‘hotcold_18lev‘)
cols[0] = ‘w‘
layer = imshowm(x, y, cloud, proj=proj, colors=cols)
colorbar(layer)
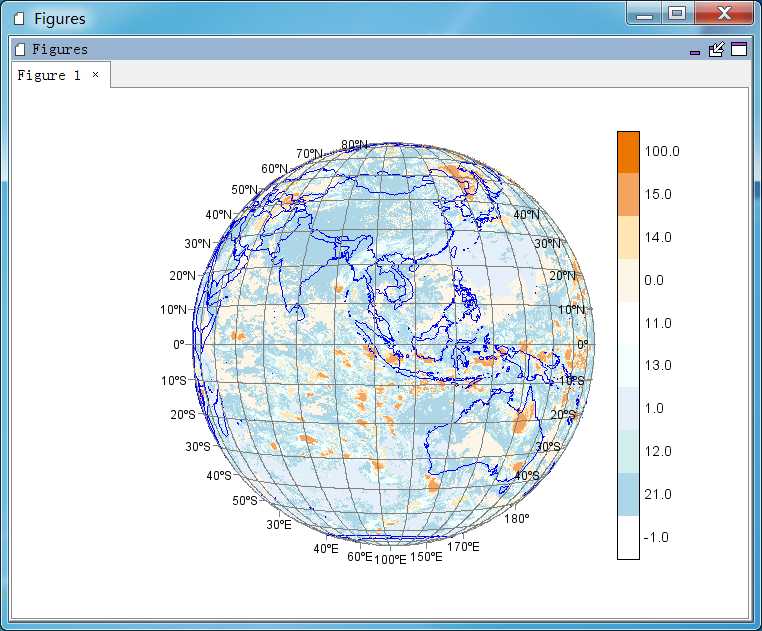
MeteoInfoLab脚本示例:FY-2C 云分类HDF数据
原文:http://www.cnblogs.com/yaqiang/p/4625524.html